#bdat An interesting element related to hertzian space and also social implications is swarming. Swarming in technological terms is related to emergent behaviour that can be created and recognised due to the extension in communication and community acheived by technologies such as social networks, bluetooth and wifi. This is explained by Brymer: "The comparison of swarm behaviour to human interaction has become increasingly relevant. Digital technology has made it possible for human communities to behave like swarms of our own."(2008)
Swarming can be experimented with in many ways using current technology. An example of this is Comfort of Strangers. Comfort of Strangers is a street game that uses iPaq PDAs and Bluetooth in which a player has to find people in the same group as themselves using information provided through their headphones, even though the people they are looking for are complete strangers. Each player has an amount of lives, and if you get too close to strangers who are on the other team you loose lives. The following is a video example of Comfort of Strangers:
The Comfort of Strangers from Simon Evans on Vimeo.
For more information on this game go to http://www.swarmtoolkit.net/index.php?option=com_content&task=view&id=18&Itemid=49. Swarming can be considered the next step in social technology, extending from the single 1 to 1 relationship provided by current mobile devices to a much more fluid, dynamic and social relationship.
Showing posts with label Inspirations (all). Show all posts
Showing posts with label Inspirations (all). Show all posts
Wednesday, 17 February 2010

Tuesday, 22 December 2009
Stonehouse - Word Clouds
#bdat When thinking about how the concept described below could be developed, it occurred to me that word or tag clouds method could be used as the basis for the data for the projection. Word or tag clouds are used to monitor the words that are used the most on a webpage or website, showing the main topic of conversation for that group of people at a glance. The word cloud displays these most commonly used words or terms in an image away from the context in which they were found. An example of this is shown below:

Word clouds provide a surprisingly effective depiction of the most topical element in a piece of text or on a website. This concept could be used in some way to produce the data for the projection as the most current and topical information in Stonehouse could be discovered using a site with a word cloud. The words picked out by the cloud could then be used in the projection, making the projection a real time demonstration of the most popular topics of discussion/interest in Stonehouse.
Saturday, 12 December 2009
Stonehouse - The depths of light communication
There are many elements to light communication from Morse Code to fibre optics. Light has been thought of as a way to communicate in many ways and this post will outline the variety of ways that light has been used for communication as well as how I think this could be developed for our project. The following is a list of different ways light has been used over the years for communication:
 This list demonstrates the extensive use of light in communication and the leaps and bounds it has taken over the years to be developed into an advanced form of communication. My first idea for this project would act as an extension of light communication beyond these previously done.
- Ancient Greeks used torches over long distances
- Morse code and coded messages from ship to ship
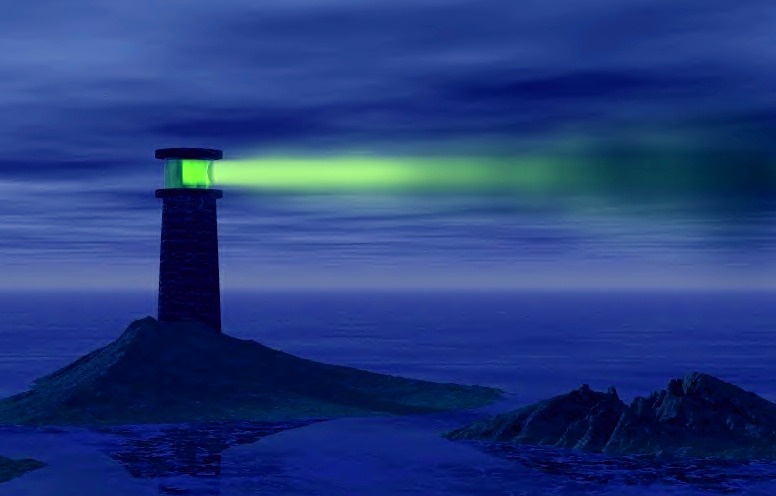
- Lighthouses transmit light to warn ships
- Alexander Bell invented a photophone to transmit speech using light
- moving LEDs fast enough to make a light trace communicating something
- Fibre Optics are the new development of light communication and and allows for communication in a much larger way as it can transmit all types of data rather than just words or meanings like the others


Friday, 27 November 2009
Stonehouse - Temporal Sculpture
#bdat Another practice similar to that of light art is carried out by a man named Geoffrey Mann. Mr Mann monitors and tracks the movement of different animals and objects and turns this information into sculptures. The sculptures made demonstrate the movement of the item over a period of time, capturing a trace of the movement that is invisible when viewed normally. This has a similar aim to that of light art, in that it helps to unveil an occurrence in our environment that we do not account for in normal life. The interesting element of this art work is that the sculpture created produces a whole new perspective whilst also demonstrating the original and recongnisable shape of the object that was traced. Below are a couple of examples of his work to demonstrate this:


This sculpture traces the flight of a moth as it is attracted to a light. As this shows Mr Mann's work creates a 3D physical sculpture that on the surface seems just like an abstract shape. However by knowing the basis of the sculpture a lot more understanding is revealed. The sculpture itself also holds this key due to the cross sections at the ends of the sculpture. By looking at these cross sections of the sculpture the viewer is able to discover the object that was mapped and so decifer the sculpture. Below is a better example of this:

This sculture is the trace of a bird landing. As you can see the cross section on the end of this sculpture can easily be defined as a bird, and so the viewer is able to then discover what the sculpture is without any explanation. (http://www.mrmann.co.uk/)
The main cause for my interest in this practice in terms of this project is the element of tracing through time to produce a perception that would not be visible. This concept could be used in some way as part of the feed that will run the projection and so having these different interpretations of this concept will help to develop how I want to use this.
Stonehouse - Light Art
ight is an important part of my Stonehouse project in many ways, and when thinking about this the production of light art occurred to me to fit well inside the main elements of this project. Not only this but I have always found light art interesting, as it can produce some beautiful images, and is based on capturing an image over time. This temporal element is particularly interesting as light art enables a person to see the trace of light that would not be visible to the naked eye, unveiling a hidden or invisible layer of information. Light art can be produce images using uncontrolled light from the rest of the environment or the image can be painted in light to a set design by the artist. Below are a couple of examples of this:

This is an image by Michael Bosanko, a light artist in South Wales who works with light art and light graffiti which is hand made to his own artistic specifications.

This is a simple long exposure image demonstrating the light art that can be produced just by environmental light sources such as passing cars.(https://www.newt.com/wohler/events/2008/hawaii/volcanoes-np/light-art-2-big.jpg)
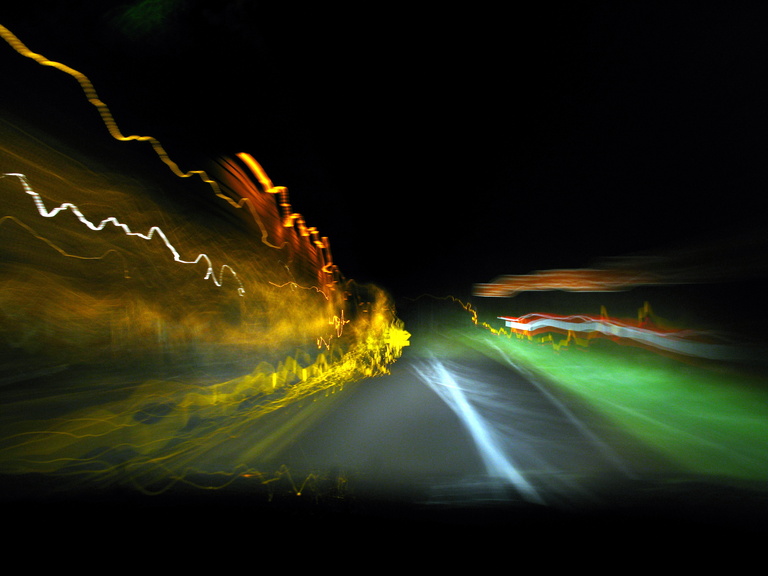
Light art is mainly produced using long exposure cameras, in which the length of the exposure can be increased or decreased to collect more or less light information. However it is also possible to achieve a very limited form of light art using a standard camera, as if a camera is moving at the time it takes the image, the changes in the image during the capture time will also be in the picture. Below is an image I took down at Stonehouse which has managed to capture an unintentional light art effect due to the movement of the camera:

However this unintentional form of light art does mean that the rest of the area is also blurry as it is captured the same way as the light. I find this image I took most interesting as the light trace it has captured is oddly like the shape of a person, leaving an almost ghostly image, which there is very little obvious explanation to as the source is not visible. The real source was however likely to be a car headlight in the distance which was blurred this way due to the capture.
This concept of the light traces left behind in the environment is one that could be used in some way for the data or the projection itself. If the projection could in some way draw the light traces that occurred in the environment previously or are occurring at the point in time of the projection it would provide the viewer with some kind of hidden history of the location. In escence the projection would be able to unveil a hidden layer of the environment around the viewer. Being that the trace could not be placed exactly onto the surface where it occurred, but only on a 2D based projection, however it may be quite hard to get the meaning of the projection across to the viewer.
Thursday, 12 November 2009
IDAT211 - Perception project
For this first term we have to create a 60 second film demonstrating a small area of our perception in the Immersive Vision Theatre(IVT), a dome projection building in the university that enables better immersion. Today we looked at a range of different videos that have been created for the dome to gain some idea of the different possibilities that can be used in the dome. In particular I found vection quite interesting, where the viewer percieves themselves, or the area they are in, to be moving when actually they are not. The immersive quality of the dome allows for vection to occur very easily, and it is in many ways the most unusual potential the dome has to offer. The concept of vection does not occur very often in normal perception although it does happen, and very rarely on any other visual viewing platform e.g cinema, TV etc. which means this project would be a great opportunity to work with a element of perception that is rarely dealt with. However working with vection does require some control as too much can have adverse effects on the viewers e.g dizziness and sickness. However as long as vection is used wisely within the dome in a balanced way, it is definitely key to using the domes full potential. Vection is in itself an optical illusion and I intend to use it as best as possible to enhance my project.
In terms of the rest of the content there are a number of things I would like to consider. Perception is a very wide topic and has many different elements that could be encorporated into the video, as well as being misrepresented to create illusions. The perception of size, alongside depth, for example is commonly used to form visual illusions. The Persil advert below shows a great demonstration of this:
This advert uses size and distance perception to create an illusion which symbolises the main point of the advert enhancing the viewers understanding and the effectiveness of the imagery. This also shows there are a lot of different possibilities in using these particular elements of perception, although this will not necessarily work all that well with vection.
Perception is based on the way in which we obtain meaning from the images we recieve around us. A lot of this is therefore knowledge based and so would be quite easy to include. For example I could use morphing elements to change between shapes in a way that emphasises the points at which a person's perception of an object becomes clear, and therefore would demonstrate what characteristics the perception is based upon.
In terms of the rest of the content there are a number of things I would like to consider. Perception is a very wide topic and has many different elements that could be encorporated into the video, as well as being misrepresented to create illusions. The perception of size, alongside depth, for example is commonly used to form visual illusions. The Persil advert below shows a great demonstration of this:
This advert uses size and distance perception to create an illusion which symbolises the main point of the advert enhancing the viewers understanding and the effectiveness of the imagery. This also shows there are a lot of different possibilities in using these particular elements of perception, although this will not necessarily work all that well with vection.
Perception is based on the way in which we obtain meaning from the images we recieve around us. A lot of this is therefore knowledge based and so would be quite easy to include. For example I could use morphing elements to change between shapes in a way that emphasises the points at which a person's perception of an object becomes clear, and therefore would demonstrate what characteristics the perception is based upon.
Wednesday, 11 November 2009
Stonehouse - Which model?
For this project we have now been given two different end models which we have to chose between to transform Stonehouse with. The first model is a projection model where a 3D simulation of a specific surface is used to project a form of animation onto the surface correctly. Below is an example of such projections from AntiVJ as shown below:
The other option is to create an installation using LEDs and arduino boards and programming them to change in some way according to a feed. Both of these options are to use feeds to produce the visual result and both also require some sort of website to power this.
Being that the focus of my project is on light and shadow, and more generally being able to see things, both of these options appeal to me. They also both have their positive and negative points that require some consideration before deciding which option I intend to go down. The following are some of the things that I have been thinking about in terms of this:

The other option is to create an installation using LEDs and arduino boards and programming them to change in some way according to a feed. Both of these options are to use feeds to produce the visual result and both also require some sort of website to power this.
Being that the focus of my project is on light and shadow, and more generally being able to see things, both of these options appeal to me. They also both have their positive and negative points that require some consideration before deciding which option I intend to go down. The following are some of the things that I have been thinking about in terms of this:
- implementation
- size
- effectiveness/impact
- target audience
- data type
- location
- invasiveness
- integration with other projects
- time
All of these elements must be considered to some extent when designing the model and also when selecting which of the models to use. Both of the models are relevant to dealing with light/shadow as they both use a light source to create a visual effect. Both models can be implemented into the area, but the size is limited for the LED model as the materials will have to be obtained, which would also have an effect on the way the LED model is implemented to have the most effect. The size of the projection is within reason unbound, as the image can be projected onto buildings as shown above, as well as on smaller spaces. Both of these models will have an impact on the environment, and the location and size are more likely to determine how much this is. In terms of the target audience for this project there are a wide range of possibilities, which in some ways is determined by the location and size also. The LED model is probably more focused towards a pavement orientated audience, such as people at bus stops and people going to night clubs. The projection model on the other hand can be orientated to almost any audience depending on its size and location. Drivers would be able to view it if it was on a large visible wall, but would not be able to see it if it was a smaller installation. A smaller projection, alike to the LED's would be more focused on a pedestrian audience. This therefore leaves the question of who precisely do I want to target and why are they the ones who most need to see my project?
In terms of data type, this is not specifically orientated to one model or another, but would be useable for either. It is more about what kind of data I want my model to portray. There are many different possibilities including emotions, news, environment data (PSQ like last year), opinions, global events etc. For example the D-Tower as shown below is similar to this and uses the areas emotions to colour the tower:

The website which should be included with the project is one of the ways in which to obtain the data necessary to work the model.
The location for the model is extremely important in having as effective a project as possible. In generalised terms the location for either model will have to be a very specific and well measured location in the Union Street area. In terms of Model 1 the possibilities include walls, floors, and ultimately entire buildings, whereas the LED model can be more closely intergrated with its surroundings such as in shop windows, on a bus stop, sign or lamppost, as well as the walls and floors. In terms of invasiveness it has to be agreed that the projection model could potentially be a lot more invasive than the LED model due to the possibilities in size. However if installed sensitively and subtly this can be prevented. The LEDs could also be invasive if there were too many, and if they were too distracting or obvious. Any installation into the area may be deemed by some as invasive as it is an addition to the environment that was not there before. The key to this is to ensure that the installation is careful enough that it does not have any negative effect, but instead improves the area to some degree.
Being that we are working in groups but are each doing our individual models, it may well be possible to integrate our models together to have a more effective result. This will be easier to achieve using Model 1 as the products will be quite different and may lead on from one to another quite easily. For example I was considering how do you get a viewers attention onto a small projection which they may well miss, say on the bottom corner of a building. However if integrated with another project, say on the floor next to the small projection, the viewers eye could be drawn from one element to the other, therefore solving the problem.
Finally time of day is important for both models, as both rely quite heavily on night viewing when it is darker and the light can be seen more clearly. This is generally true for all projects like this as shown in the two examples above. However being that my focus is on shadows as well as light I may be able to develop some way of getting around the problem in relation to my project.
After considering these elements I feel that I would like to choose the projection model as my preference as it seems to hold the most flexibility and potential for a project out of the two. I am quite interested in perhaps projecting onto the floor rather than a wall as this is a different perspective to take and aligns with the concept of shadow. However I am also interested in doing a wall projection, but one that is quite small, enabling a more subtle development of the environment, that will encourage people to improve their understanding and interaction with the environment in order to get the most from it.
Friday, 23 October 2009
Stonehouse - boundary separation
Another aspect of both Stonehouse and Union Street that I find interesting is the lack of knowledge about the boundaries of the area. Many people who travel down Union Street are unlikely to acknowledge the fact that they are travelling right through the heart of the Stonehouse region. The joining of Stonehouse, Derriford and Plymouth into a single city i.e Plymouth, meant that the boundaries between the areas have become much more blurred. Therefore those who travel down or up Union Street are more likely to understand the area to be Plymouth than Stonehouse, apart from perhaps those who live locally and have built up a history of the area via this. Stonehouse being such an important area historically, and still an interesting and dyanamic location to this day should probably have more acknowledgement as a location than it is currently recieving. This interests me in terms of improvements to the area, as it would be good to bring a stronger identity back to the area. Below is a picture of a sculpture in California that acts as a signifier of the boundary between Beverly Hills and West Hollywood:

The sculpture looks and acts almost like a pillar between the two locations and creates an "entrance gateway" that pedestrians are able to travel underneath, almost transporting them between the two worlds.
This sculpture is interesting as it is interactive as well as symbolic, and also very environmentally friendly. Although most interesting at night, the Empyrean Passage also is functional in the day due to the added illusive effect on the inner edges of the rings. This therefore allows for a very functional, engaging and effective addition to the environment whilst giving an invisible, yet important boundary, a physical representation.
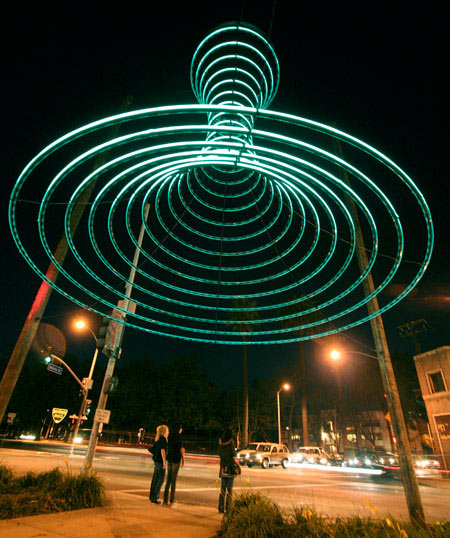
This sculpture, as well as being used to identify the boundary is also engaging as it draws the viewers eye upwards as you walk below it, and in doing so, allows for an optical illusion to occur in which the colour of the sky is altered at certain times of day. Labelled the Empyrean Passage, Dan Corson the creator said:
"Empyrean Passage is reminiscent of both a theoretical black hole and portal into the celestial worlds ... The form is constructed like a giant hoop skirt and gracefully moves in the wind, creating a gossamer lighting effect overhead. While this project is an oculus to the heavens, more focus is usually paid to more terrestrial stars in this neighbourhood. "
The sculpture looks and acts almost like a pillar between the two locations and creates an "entrance gateway" that pedestrians are able to travel underneath, almost transporting them between the two worlds.
This sculpture is interesting as it is interactive as well as symbolic, and also very environmentally friendly. Although most interesting at night, the Empyrean Passage also is functional in the day due to the added illusive effect on the inner edges of the rings. This therefore allows for a very functional, engaging and effective addition to the environment whilst giving an invisible, yet important boundary, a physical representation.
Thursday, 22 October 2009
IDAT 211 - Visual Perception
Visual perception outlines the ways in which we use visual cues to create meaning in the world. These include paralax, focus, binocular, and monocular cues. However our perception can easily be tricked, by subverting the normal rules assoctiated with how we percieve our world. It is this, the amount of different ways in which we have challenged our visual perception that intrigues me most. Usually refered to as optical illusions, these exceptions to the rules of perception occur both intentionally and unintentionally, either by means of creation for entertainment, or by conicidence. For example many people use their artistic talents and also computing to create a wide range of optical illusions, which can require the viewer to either be active or passive in changing their perception. This is intentional subversion. However things such as the Charlie Chaplin mask experiment mentioned in the previous post, although set up for the video, may still occur with a mask in every day life. This is therefore (mainly) an unintentional subversion. Intentional subversion of our perception is much more common, due to the continuous creation of illusions for entertainment. Below are a few examples of different types of illusion, both passive and active:

 Julian Beever street art shown from the correct and incorrect viewpoints (passive perception as long as you are in the right place)(http://blog.brains4all.com/brainblog/archives/globe.jpg)
Traditional optical illusion the composition of the image causes your eyes to see black dots where the white gaps are (passive)

 Young woman - old man optical illusion. This requires the viewer to actually turn the image upside down to see the illusion occur (active) (http://www.yugzone.ru/optical_illusions/img/catPics_perevert.gif)
This therefore demonstrates the wide range of different illusions that exist and how they can be passive or active depending on their content. All of these images work in some way due to the ways in which our perception functions along a set of rules which we have learnt from birth. By knowing these rules and developing things that go against them we are able to test our own perception and find out more about the way we find meaning in objects.
Monday, 12 October 2009
Stonehouse - Ideas on mapping
Today was the first workshop session on this Transforming Stonehouse module. The first task for this project is to create individual maps of certain elements of the area, without visiting it, so that we can compare our own presumptions with what actually exists. In order to create some mapping for the area I intend to investigate different drawings that have been done by others to create similar effects. Below are some of the things that I have found:
![]() This is an image of different peoples perception of where downtown is in Santa Barbara. This is an interesting map of the area and applies to this project as it strays away from the factual boundaries of the area, and instead focuses on personal opinion. To see a larger version of any of the images in this post just click on the picture.
This is an image of different peoples perception of where downtown is in Santa Barbara. This is an interesting map of the area and applies to this project as it strays away from the factual boundaries of the area, and instead focuses on personal opinion. To see a larger version of any of the images in this post just click on the picture.
![]() Another way of mapping a city is through looking at populated areas. A Blackberry and iPhone application, CitySense does just that. This uses GPS data to show the busiest places in a particular area and represents this using heat spot imagery, demonstrating the existence of a large number of people as shown in the image on the right. (http://www.technologyreview.com/communications/22286/?a=f) This allows users to find out the most popular places to go in their area. Although this software continues to use an average road map of an area, it is also mapping population on top of this, a mapping system that could be used in this project.
Another way of mapping a city is through looking at populated areas. A Blackberry and iPhone application, CitySense does just that. This uses GPS data to show the busiest places in a particular area and represents this using heat spot imagery, demonstrating the existence of a large number of people as shown in the image on the right. (http://www.technologyreview.com/communications/22286/?a=f) This allows users to find out the most popular places to go in their area. Although this software continues to use an average road map of an area, it is also mapping population on top of this, a mapping system that could be used in this project.
![]() The usage of space in Stonehouse is important in undertanding all the factors that make up the character of Stonehouse today. The way in which spaces are used can explain whether the area is rich, poor, greenbelt, brownfield, or redevelopment sites. Mapping this could therefore be beneficial in understanding the Stonehouse area and choosing a specific area to focus on. By mapping these things the tradtional road map imagery is taken away and the focus falls on more dynamic elements. This is demonstrated in the image on the left (http://nexthotmarket.com/library/mapping.jpg). In this map of a location the focus is on the usage of the area, and the roads, although included are less obvious to the reader. This therefore creates a completely different perspective of the area.
The usage of space in Stonehouse is important in undertanding all the factors that make up the character of Stonehouse today. The way in which spaces are used can explain whether the area is rich, poor, greenbelt, brownfield, or redevelopment sites. Mapping this could therefore be beneficial in understanding the Stonehouse area and choosing a specific area to focus on. By mapping these things the tradtional road map imagery is taken away and the focus falls on more dynamic elements. This is demonstrated in the image on the left (http://nexthotmarket.com/library/mapping.jpg). In this map of a location the focus is on the usage of the area, and the roads, although included are less obvious to the reader. This therefore creates a completely different perspective of the area.
 This is an image of different peoples perception of where downtown is in Santa Barbara. This is an interesting map of the area and applies to this project as it strays away from the factual boundaries of the area, and instead focuses on personal opinion. To see a larger version of any of the images in this post just click on the picture.
 Another way of mapping a city is through looking at populated areas. A Blackberry and iPhone application, CitySense does just that. This uses GPS data to show the busiest places in a particular area and represents this using heat spot imagery, demonstrating the existence of a large number of people as shown in the image on the right. (http://www.technologyreview.com/communications/22286/?a=f) This allows users to find out the most popular places to go in their area. Although this software continues to use an average road map of an area, it is also mapping population on top of this, a mapping system that could be used in this project.
  The usage of space in Stonehouse is important in undertanding all the factors that make up the character of Stonehouse today. The way in which spaces are used can explain whether the area is rich, poor, greenbelt, brownfield, or redevelopment sites. Mapping this could therefore be beneficial in understanding the Stonehouse area and choosing a specific area to focus on. By mapping these things the tradtional road map imagery is taken away and the focus falls on more dynamic elements. This is demonstrated in the image on the left (http://nexthotmarket.com/library/mapping.jpg). In this map of a location the focus is on the usage of the area, and the roads, although included are less obvious to the reader. This therefore creates a completely different perspective of the area.
There are many other ways of mapping a city and many other elements that can be mapped. http://www.intelligentagent.com/archive/Vol6_No2_interactive_city_sant.htm shows a number of different and interesting ways of mapping the environment, which both follow conventional and non-conventiona lines, the main aim being to step away from the necessity of using a traditional grid/road map, and discover other more specific and dynamic ways of mapping the area.
Friday, 2 October 2009
IDAT211 - Channel 4, an example
#bdat Whilst considering the concept of perception and cognition and the way in which our perception can be utilised, I began to try and think of examples that demonstrated these concepts other than those shown to us in the lecture. It occured to me that the Channel 4 idents are very much relevant to this as they are designed to utilise our perception in order to give the channel an identity. An example of the idents is shown below:
This is similar to the Charlie Chaplin mask optical illusion shown here:
This is similar to the Charlie Chaplin mask optical illusion shown here:
At a very specific point in time the 4 is seen in the image and then instantly disappears because of the angle that viewer sees the image from. This demonstrates the discovery and loss of meaning in the image. This and the other channel 4 adverts have been built specifically to have this effect in which the ident is not understood until a certain point and then the meaning is lost again. By doing this the ident keeps the viewers attention and ensures other information such as that of the voiceover is also recieved.
IDAT 204 - Concept Ideas
After deciding on a general idea of the Org-ant for our project, yesterday Sara and I got together to try to get some more detailed ideas of what our project aimed to do. We knew that we wanted to design a product that would show a group of ants working as an organism rather than just a single creature. In researching this concept I found a number of examples that have previously been made relating to this concept of a virtual ant farm. Two examples are listed below:
This gave us an idea as we could use the product to cross over the lives of human and ants, therefore creating an ant-human interactive environment that had not been looked at before. This meant we could encorporate elements of human lives into an ant built environment such as an ant farm. The following was a page of ideas we drew up yesterday including GUI design and functionality:
![]()
http://www.geocities.com/chamonate/hormigas/antfarm/ (zip file needs to be downloaded)
I was not surprised at this result as the ant concept is used a lot in computing, such as in Langton's ant. This therefore meant we needed to find a way of producing an ant farm that would be individual and have more depth than those previously designed. After researching into ants Sara found the video below:
(to see a larger version click on the image)
From these designs we decided on a few key points that we wanted to encorporate. The main elements that we have currently settled on are listed below:
- Underground ant environment
- Interactive element - placement of walls: this will prevent the ants from using a tunnel and so they will have to build/change to a different tunnel. This is key to demonstrating the intelligent behaviour required as part of this project
- Interactive element - Placement of a microphone(image) into the environment: This will cause one of the ants to interact back to the user with an item of speech, demonstrating commuication. This is an interesting element as the interactivity then works both ways
- Interactive element - food: Placement of food such as an apple into the area will attract ants and the food will then be eaten, unblocking the path and demonstrating the need for food that all organisms share
- Interactive element - Placement of money: Money is very important to human society so money objects will be included and will cause the ants to swarm towards it.
- 3D objects in a 2D/1D environment - the interactive elements will look 3D to make it seem like elements from reality are being placed into the virtual ant farm environment
- The ants will either be 1D dots or simplistic 2D elements that detract away from the specific imagery of ants, allowing the human-ant connection to be more easily recognised
These elements we hope to be able to encorporate into the final product. We now need to refine our designs and settle on a final proposal, after which we will start building the product.
Stonehouse - A history
The area currently known as Stonehouse in Plymouth began as East Stonehouse prior to the conjuction with Devonport and Plymouth in 1914 which became the Plymouth we know now. The suburb began as a fishing village placed between the two larger towns of Devonport and Plymouth and due to the introduction of the Navy hospital and depots has grown in prosperity and popularity. The most major historical event of the Stonehouse region was the destruction cause during the Plymouth blitz to the area. Due to the major naval involvement in the area Plymouth and its surroundings were heavily targetted and much of the area was lost. Since then the area has slowly been regenerating and now consists of both poorer and richer communities with the richer becoming the more dominant society. This is having a major effect on both the economy and general character of the area which was previously known to be an overly poor community. The city council has been a major aid in regenerating the area and continues to put money into projects that will help it to improve. The Parish Church restoration was recently completed in 2007 and many more plans have been created since then for the regeneration of the area. The main aims documented for the council between 2006 and 2021 cover 7 different areas of the Stonehouse region, including developing areas such as the Royal Williams Yard, Union Street and the Docks. This shows the amount of work there still is to do is very extensive. For more information see the city council links below:
![]()
Action Plan: http://www.plymouth.gov.uk/millbay_aap_4web.pdf
The topography of the Stonehouse area has also changed over time. During the existence of the East Stonehouse region the area was separated from Devonport via a lake area known as Mill Lake or Stonehouse Lake. Part of this area is now a grassy plain known as Victoria Park. This is therefore a very different area to what it used to be when the lake still existed. Below is an image when the lake existed. Click on the image to view a larger version. Compare this image with the one in the introduction below, where Victoria Park is shown.

This short overview shows that there are many different areas that can be studied around Stonehouse, not only physically but also socially and economically. Changes over time are also very important to the area and these are continuing to occur which will be an important factor to consider during the project.
References:
Subscribe to:
Posts (Atom)